My development team at work yesterday picked up a task to investigate a error that was periodically showing up in our production logs: NoMethodError: undefined method `>' for nil:NilClass
This is a common Ruby error that occurs when you try to call a method on a variable with a value of nil. In this case, the "method" in question was the greater-than operator, ">". The line of code associated with the error in question was actually a conditional evaluation that involved 3 separate ">" evaluations, which obscured the exact variable that was the source of the error a bit. Two of the three variables in question were attributes of an ActiveRecord model object whose associated database column was defined as NOT NULL. Those attributes were not being re-assigned after being read from the database, so we initially ruled them out as being the possible cause of the error.
However, further investigation revealed that none of the three variables on the problematic line of code could -- in theory -- possibly ever be null. Faced with this, I decided to take a closer look at the actual data in the database.
Our production environment is split into multiple MySQL databases. For purposes of conveniently being able to query customer data across databases all at once, we have an ETL process which extracts (non-sensitive) customer data from the source databases, and populates it all into a single central Snowflake SQL database. The database structure of the relevant table (Users) was similar to this (simplified for brevity): - id: INT, primary key
- first_name: VARCHAR(255)
- last_name: VARCHAR(255)
- updated_at: DATETIME, NOT NULL
Temporarily putting common sense aside, I queried the snowflake database to see if any of the NOT NULL updated_at values were nevertheless null: SELECT * FROM Users WHERE updated_at IS null
This returned 0 results, as expected. Acting on a hunch, I tried searching for unexpectedly old records; this database has been in service since about 2009: SELECT * FROM Users WHERE updated_at < '2005-01-01'
This query did produce some results! Out of the tens of thousands of records in the Users table, a few hundred records were returned whose updated_at date was '1970-01-01 00:00' -- a value equal to the start of the epoch in Unix time. At this point I questioned: Does Ruby on Rails and/or ActiveRecord somehow treat start-of-epoch date values of '1970-01-01 00:00' at nil? This seemed unlikely, but I tested it anyway, setting the updated_at value for an existing record in my local machine's copy of the database to that start-of-epoch value; and then reading the record into the corresponding ActiveRecord model object. Not unexpectedly, the updated_at attribute on the model did not end up with a nil value; it had the expected value of midnight on January 1, 1970. I still felt like I might be onto something here, though. At this point, I wanted to inspect the data in the actual MySQL customer database. I don't have access to the live database, but I was able to access a read-only replica of the database. Having connected to that MySQL database, I verified that the updated_at column was still defined at NOT NULL; it was. I then ran the same query to look for old values: SELECT * FROM Users WHERE updated_at < '2005-01-01'
As before, this returned a few records -- about 300. However, I noticed that the actual updated_at values were different. This time, they were returned as '0000-00-00 00:00'. Year "0", month "0", day "0" -- all nonexistent values. Feeling a bit of a chill, I re-ran my earlier query to look for records with null values: SELECT * FROM Users WHERE updated_at IS null
MySQL returned the same 300 records.
Cool, cool, coolcoolcool. The evidence indicated that (1) MySQL was allowing values of '0000-00-00 00:00' to be set on a DATETIME, NOT NULL column; and (2) despite the aforementioned NOT NULL restriction on the column, was evaluating such values as being null. To close the loop, back on my local development machine's database, I set an existing record to the '0000-00-00 00:00' value -- which MySQL happily allowed -- and then, in the Rails console, populated a model object from the record. Sure enough: The updated_at attribute on the record had been assigned a value of nil. Summary of findings(1) In a Rails application (and possibly in other languages / frameworks as well), it may not be safe to assume that a value read from a DATETIME, NOT NULL column on a MySQL database is actually guaranteed not to be null. MySQL allows a value of '0000-00-00 00:00' to be set in such columns (despite the NOT NULL restriction); such values are treated as null both my MySQL itself, and by Rails / ActiveRecord.
(2) Although I'm not familiar with its inner workings, that the ETL process from the multiple production MySQL databases to consolidate data into a single Snowflake database couldn't 100.0% be trusted not to change data values. In this case, it silently converted MySQL DATETIME values of '0000-00-00 00:00' to values of '1970-01-01 00:00'
MitigationsDoing a bit of additional reading after the fact, I found a StackOverflow post that references a MySQL configuration mode of "NO_ZERO_DATE," which when set, prevents such "zero date values" from being set. According to the MySQL documentation, not setting that option may be "more convenient" and/or consume less space. Based on my team's experience here, though, I'd certainly be inclined to take advantage of that NO_ZERO_DATE setting whenever feasible!
I was having a problem where, when playing the game Phoenotopia Awakening on my MacBook using a Nintendo Switch Pro Controller connected to the Mac via Bluetooth, I was getting pretty significant "input lag": About half a second would elapse between me pressing a button on the controller, and the character reacting on the screen, making the game nigh-unplayable. Oddly, this issue would only occur with my MacBook "docked" -- connected on my desk to my multiple monitors, wired ethernet, and various other peripherals. When using the MacBook as a standalone laptop, the game and controller would play just fine. Even in the "docked" configuration, however, outside of Steam, an in-browser gamepad tester showed that the controller was communicating with the MacBook with no lag.
I found the following to be an effective workaround for the problem: - In Steam (not in "Big Picture" mode, and with the game not running), locate the game in your Library.
- Right-click the game and select Properties.
- On the Controller tab, select "Disable Steam Input".
Voila -- No more input lag with the Nintendo Switch Pro Controller, even when docked! Hat tip to "Toms33" for posting this solution in a thread on the Steam Community forums.
What happened?At work this past week, I was alerted to a problem where a background job which processes incoming messages from a particular queue had slowed down dramatically. As a result, a significant delay had developed in providing certain event notifications to our customers.
Our monitoring tooling showed that the culprit was a particular SQL Server stored procedure -- one that gets invoked as a part of processing each message from the queue. Execution time of that sproc had suddenly increased from near-instant to an average of 4 seconds, with spikes up to around 20 seconds. (The queue processing job is multi-threaded, so we were still processing about one message per second, but that was no longer keeping up with the incoming volume of messages during the busy hours of each day.) No code deployments or changes to the environment had been made around the time of the initial slowdown; this problem had started occurring without an obvious root cause. Our investigation
The stored procedure in question comprises about a dozen individual SQL statements and queries. It wasn’t immediately clear which individual statement in the sproc was responsible for the slowness.
After a few initial investigative paths didn’t yield results, I decided to run a short trace on the live production database. The trace revealed that one particular SELECT query was consistently taking a long time to run during each run of the stored procedure.
Interestingly: When I ran that same SELECT query SQL manually, it completed near-instantly. However, when I ran some minor variations on that SELECT query, they did take a long time to execute. Execution plans and indexes
SQL Server internally generates an “execution plan” for each query that it runs, whereby it decides how it will go about performing the operation that the query's SQL calls for. The SQL Server Management Studio tool is able to display these execution plans in a nice graphical format.
When the problematic SELECT SQL was run manually, the execution plan showed that it was – correctly – leveraging an existing index on the target table. That index had been originally added to support this specific query. It includes fields needed by the query’s lookup criteria.
Looking back at the results of the trace, the problematics SELECT queries being run during execution of the stored procedure were being run using a different execution plan – not leveraging the custom-designed index at all! A full table scan was being run by SQL Server to gather the query results. As that table currently sits at a total row count of over 150 million, those queries were taking a while to run! The specific SQL being run (simplified a bit here for readability) was:
SELECT TOP 1 ID
FROM myTable t
WHERE t.CreationDate > DATEADD(day, -30, GetDate())
  AND (t.Email = @Email OR t.PhoneNumber = @PhoneNumber)
  AND t.CompanyID = @CompanyID)
ORDER BY t.ID ASC
The custom index includes the following fields: - CompanyID
- Email
- CreationDate
- PhoneNumber
Can you spot the problem?
…
Take a look at the ID field. That field isn’t part of the index; but it is being used in the SQL’s ORDER BY clause! And that clause, as it turns out, is used by the database as one of the factors in how it seeks for the single (TOP 1) row to return.
Through its own inscrutable internal algorithms, prior to April, SQL Server had been using an execution plan that did leverage the custom index for this query, despite the presence of the ID field in the ORDER BY clause. After April, some tipping point in the database’s characteristics was evidently hit that made SQL Server decide to no longer use that index in its execution plan during runs of the stored procedure.
The fix was to adjust the SELECT query to ORDER BY CreationDate, rather than by ID. This had the same logical effect with regard to selection of the returned row; and it got SQL Server to once again use our custom index while running the stored procedure, resulting in the resumption of speedy performance in processing of messages from the queue. How did we verify that the fix worked?
- We observed that new records continued to be inserted correctly (and now, a lot more quickly!) into the database table.
- Execution times for the stored procedure went way down. We could see this both from the database itself, and from the our queue's web interface – the green line here is the rate of messages being processed off the queue, with the fix having been applied just after the 10:20 mark:
So what are the lessons here?- Having the ability to determine which specific SQL statement was the root cause of the downstream slowness was key to being able to devise a fix. (The fact that our monitoring instrumentation only reported to the granularity of which stored procedure was running slowly -- but not which individual SQL statement within the sproc was slow -- made this trickier.)
- The availability of multiple weeks of monitoring data from our instrumentation did make it quick and obvious to confirm that there had been a dramatic change in performance from one of our stored procedures, which was the cause of the problem.
- When a particular SELECT statement is slow, ensuring that a properly-matching database index is in place – and that index is being applied to live queries in the expected manner – is a very good thing to check!
 Near the beginning of Steve McConnell's classic book on software construction, Code Complete -- it's the one where Jeff Atwood's "Coding Horror" icon image originally came from -- several analogies for the process of creating software are considered, including penmanship, farming, and oyster pearl harvesting, before McConnell finally settles on "construction." At my job, although I'm primarily a software developer, I do also occasionally put on the hats of DevOps specialist and DBA. In particular, this happens when a legacy server that I'm responsible for experiences production issues, and I'm one of the few with the knowledge and experience to figure out what's wrong, and get it up and running smoothly again.
This morning, while making another pass at troubleshooting a stubborn partial outage that had recently started cropping up on a near-nightly basis, where performance of the production website and/or database was being degraded in the early morning hours for a period of around an hour or two, another analogy for the type of production software maintenance occurred to me: that of sculpting! In troubleshooting this outage, my colleague and I have taken the approach over the past several days of of making a single change that might hopefully resolve the issue; then, waiting to see if the issue still recurred. If so, we'd make another change. It occurred to me that this was not so dissimilar from the quote attributed to the sculptor Michelangelo saying, in reference to beginning a sculpture, that the desired figure is already in place; the excess marble that does not comprise the statue just needs to be chiseled away. By way of example, here are some of the incremental changes we attempted, in working towards resolving our persistent nightly outage: - Monitoring the performance of the database during the outage, we observed that a particular stored procedure was comprising much of the runtime. We optimized that stored procedure by improving a couple of the existing table column indexes used in the sproc's query plan, to reduce the overall number of lookups the stored procedure needed to perform.
- We altered one of our nightly scheduled jobs that was running concurrent with the outages to avoid calling the possibly-problematic stored procedure at all; instead, we fulfilled the job's data needs by adding some additional output fields to another query the job was already making.
- Examining the raw server logs of incoming HTTP requests, we observed that a number of poorly-behaved bots (no user-agent strings; no reasonable rate limiting) were hitting our site very aggressively during the outage period -- and that the pages being hit were triggering calls to that same stored procedure. As at least an interim fix, we put rules in place to prevent the pages being hit from being rendered in response to those particular requests.
Each of these steps of trimming off poorly-performing code and problematic incoming requests has felt a bit like chiseling away some stone, hopefully in the end arriving at a nice statue -- or in our case, a stable production system!
Early this morning, I tried to launch the game Children of Morta on Steam running on my Mac. The game failed to open, and Steam displayed the error "OS Error 4294956486".
Solution
Deleting the game via the Steam (via Library → Right-click on Children of Morta in the list → Manage → Uninstall), and then redownloading and reinstalling Children of Morta, fixed the problem for me, and I was able to get a little gaming in before my work day.
Other solutions attempted that didn't work for me
- Restarting Steam.
- Restarting my Mac.
- Launching the game manually via the command line.
- Doing a "Verify Integrity of Game Files" (via Library > Right-click on Children of Morta → Properties → Local Files tab → "Verify Integrity of Game Files" button).
Since all the way back in 2008, during most of which Windows was my daily-use operating system for work and hobbies, I used, and was a big fan of, a utility called TimeSnapper. Billing itself as "The Automatic Screenshot Journal", TimeSnapper quietly would run in the system tray of my Windows computer, taking a screenshot of whatever application I was actively using every few seconds. TimeSnapper additionally came with a "Play Your Day Like a Movie" feature, where I could watch my entire day of work, or jump directly to the screenshot of any point in time of the day.
TimeSnapper saved me on multiple occasions where I would have otherwise lost work. A couple of examples of this:
- I'd been typing some long-form text into a form on a web page, only to have the browser crash and lose all of my work. Without TimeSnapper's most recent screenshot of my work-in-progress post, I'd have had to recreate the text from scratch, instead of simply having to retype it. (See my 2014 tweet about the incident!)
- I'd run into a problem with a program, where it displayed a particular error message in a dialog. A few minutes later, I wanted to Google the error to try to find a solution. I couldn't remember the exact text of the error in order to type it into Google... but TimeSnapper had captured an image of the error dialog, so there was no problem!
In early 2017, taking on an assignment with a new product at work, I switched to working on a Mac, making my primary daily-use operating system macOS instead of Windows. One of the first things I did, naturally, was to look for macOS equivalents of the essential utilities that I had come to rely on for software development and other work on Windows.
Although I was able to find many useful equivalents for utilities such as clipboard history saving, I wasn't able to find anything like TimeSnapper. Seemingly at least once every week after switching to Mac, I'd run into some situation like the ones described above where I wished I could look back in time to retrieve some important piece of information that I know I had on screen a short time earlier, but was now lost.
Fast-forward to the present day, and I'm super excited to announce: The official release of TimeSnapper for Mac is now available!
Why am I able to announce this? Because, in partnership with the original developers of TimeSnapper for Windows, Leon Bambrick and Atli Björgvin Oddsson, I am the developer of TimeSnapper for Mac!
By late 2017, I was frustrated enough with not having TimeSnapper or a similar utility in my day-to-day work that I reached out to Leon, asking if there was any news around a Mac release of TimeSnapper. Leon replied that there was not; but after some conversation, he offered me the opportunity to develop it!
After a long journey, starting with me not even knowing whether making a macOS version of TimeSnapper would be at all possible -- for example, whether macOS even had operating system hooks allowing an application to perform screen captures -- TimeSnapper for Mac is now complete, and is available on Apple's Mac Store as of today!
Some of the major milestones in TimeSnapper for Mac's development, using Objective-C and Xcode, included:
- Getting a simple, UI-less program working which successfully managed to take and save to disk a screen capture of the Mac desktop.
- Making the program "wake up" at regular intervals to take screen shots -- and continue to do so even if the computer is put to sleep.
- The ability to pause, and later resume, the capture of screen shots on command.
- Adding an option to reduce screen shots in size and/or quality before saving them to disk -- and adding a Preferences window for the user to control these options, as well as the delay between screenshots and the image format (.jpg or .png).

- An option to capture just the foreground application window, the entire monitor where the application is running, or all monitors (on a multi-monitor system). Due to the way the relevant macOS hooks work, just successfully identifying the foreground-most window was surprisingly challenging, but after lots of effort and testing, TimeSnapper is able to get it right for almost all applications.
- Adding a "preview image" of a screen shot to the Preferences window with the selected size and quality options applied, as well as an estimate for how large the screen shot would be on disk with the selected options.
- Adding "auto cleanup" of old screen shots to save disk space, along with Preferences window options for the user to specify a maximum age of saved screen shots, and/or maximum disk utilization for all screen shots.
- An option to open a new Finder window, navigated to the folder where TimeSnapper saves its images.
- Getting TimeSnapper to optionally start automatically after reboots. (This functionality on Mac was almost shockingly difficult to implement relative to what I expected, requiring quite a bit of code along with a whole "sub-application".)
- Getting TimeSnapper to appear as an icon and menu in the Mac's
top Menu Bar, and to display its larger Dock icon only when one of its
windows is open.
- An initial "Play Your Day Like a Movie" window, displaying one of the saved screen shots.
- Adding a timeline to the Play Your Day window, displaying a range of hours corresponding to the earliest and latest screenshot captured for a selected day, and a tick mark on the timeline for the time of every individual screenshot taken.
- Getting a mouse click -- and later, drag -- on the timeline to change the image display to the image taken nearest to the clicked time.
- Adding the eponymous ability for the window to play the selected
day's screenshots like a movie, with playback controls for
starting/pausing the playback and increasing or decreasing the playback
speed.

- Handling local time changes properly, so that "going back in time" by carrying the Mac across a time zone boundary from east to west, or at the end of Daylight Saving Time, doesn't cause screen shots to appear out-of-order in the Play Your Day window, or to potentially overwrite one another.
- Lots more polish and bug squashing!
It's been a genuine pleasure over the past few months, in the later phases of development, to once again have had TimeSnapper running on my daily-use computer -- now, a Mac -- affording me the ability to easily peer back in time and see exactly what text or activity I previously had on my screen!
Check out TimeSnapper on the Mac App Store! If you like it, I'd love it if you'd leave a nice review, or just drop me a line (here in the comments, or find me on Twitter) and let me know what you think!
I've recently been fighting an intermittent issue in a specific Ruby on Rails app running on a Phusion Passenger web server on my local macOS development machine: HTTP requests to the app would intermittently return the error "Incomplete response received from application" wrapped in a simple h2 element, instead of the desired resource.
When this occurred, I'd also see a message like the following appear in the Phusion Passenger web server log:
App 6510 output: [ 2019-06-27 12:07:49.0318 6510/0x00007f83639eb6f8(HTTP helper worker) utils.rb ]: *** Exception Errno::EBADF (Bad file descriptor) (process 6510, thread 0x00007f83639eb6f8(HTTP helper worker))
Oddly, no one else working on this application saw these errors while running the app on their machines, even though as far as we could tell, we were all running pretty much the exact same environment.
The workaround
I found that I could get this issue to stop manifesting on my machine by appending the following parameter to my passenger server start-up command:
--spawn-method direct
This resulted in the complete Passenger start command for the application looking like:
bundle exec passenger start --port 3000 --max-pool-size 4 --min-instances 4 --spawn-method direct
Explanation
The key to coming up with this workaround was an article on the Phusion Passenger website: Spawn methods explained (for Ruby developers).
That article talks about how, in order to save memory and improve start-up time, Passenger uses a "spawn method" setting of "smart" for Ruby applications by default. That setting accomplishes that by having multiple server processes share certain objects in memory.
A caveat of the "smart" spawn mode noted by the article is unintentional file descriptor sharing. This caught my attention: Research I'd done on the "EBADF (Bad file descriptor)" error noted that it could be caused when a file descriptor -- that is, a handle pointing to a resource like a local file or a network socket -- is closed, but then accessed again after being closed. If such a handle was being unintentionally shared between web server processes, it does seem entirely plausible that one process could close a handle, then the other process could try to use it for something.
It seemed logical that configuring Passenger to not share objects between processes, via using the "direct" spawn mode setting instead of the "smart" setting, would avoid this. Sure enough, using the "direct" setting did immediately stop the "Incomplete response from application" errors I was seeing in my local environment. Additionally, running the app on my local machine (with myself as the only user), I didn't observe any meaningful degradation in app performance.
What I'm still unsure about at this point is exactly what specific handle was being incorrectly shared between processes, and why no one else working on this application was having the same error that I was manifest in their environments. Thus, I'm considering this a "workaround" rather than a "solution" for the time being. (And I'm not committing a change to have the app use the "direct" spawn mode in any environment other than my own.)
Other solutions attempted
Prior to finding the workaround, as all signs pointed to this being some kind of environmental issue with my local machine, I tried to "fix" my environment in quite a few different ways:
- Use a different client browser
- Restart the Passenger web server
- Reboot
- Reinstall Ruby 2.6.3
- Revert to an older Ruby version (2.5.3) using rvm (and uninstall 2.6.3)
- Reinstall gems via bundle install --force
- Clone a fresh copy of the Rails application code itself from the remote repository
- Run the application on a different port (other than 3000)
- Update the database (mySQL) to the latest patch version
- Increase the limit of open files per process via ulimit -n 8192
- Increase the database pool size in database.yml
None of those attempted fixes made a difference; the "Incomplete response received from application" response to HTTP requests, and the "Errno::EBADF (Bad file descriptor)" in the server log continued to manifest.
I had initially suspected the Ruby 2.6.3 upgrade to have something to do with the problem, as I had first started noticing the issue around the time I made that upgrade locally. However, as downgrading to 2.5.3 didn't fix the issue -- and others working on this app were running 2.6.3 with no issues -- I ended up concluding that the 2.6.3 upgrade did not seem to be the direct cause of the issue.
I'd very much like to understand what is actually causing this error in my environment. In the meantime, though, I'm very happy to finally have a viable workaround, so I can get work done again!
On the MacBook Pro (2017, with Touchbar) that I currently use as my primary development computer at work, after I "docked" the computer (reconnected all external monitors and devices) this morning, my monitors were in the wrong order.
Further, the display on one of the external monitors -- a Dell 2415H, connected via USB-C port → USB-C to HDMI adapter → HDMI cable → HDMI port -- had an extremely blurry display. That monitor also now had "overscan" of about a centimeter; that is, the image extended past the viewable area of the screen in all directions (so that I could only see the bottom edge of the menu bar at the top of the screen).
Fixing the display order was a simple matter of going into System Preferences → Displays → Arrangement, and dragging the monitors back into the proper order.
However, it took a little longer to figure out a solution to the blurriness issue. In the System Preferences → Displays window for the blurry monitor, the Resolution radio button was set to "Default for display" as usual. When I changed it to Scaled, the available values were "1080i" (selected), and 720p.
Changing the setting to 720p caused the display to be sharp again, but everything on that monitor ended up being sized way too large. (Plus, I then was only presumably getting 720 pixels of vertical resolution, instead of the 1920x1080 of which the monitor was capable.)
The solution turned out to be to close the Displays windows, unplug and replug that monitor's HDMI cable, and then open System Preferences → Displays again. After doing that, the Displays window → Color tab → Resolution (scaled) selection for the blurry monitor now displayed two additional options which weren't there before: "1080p" and "1600 x 900".
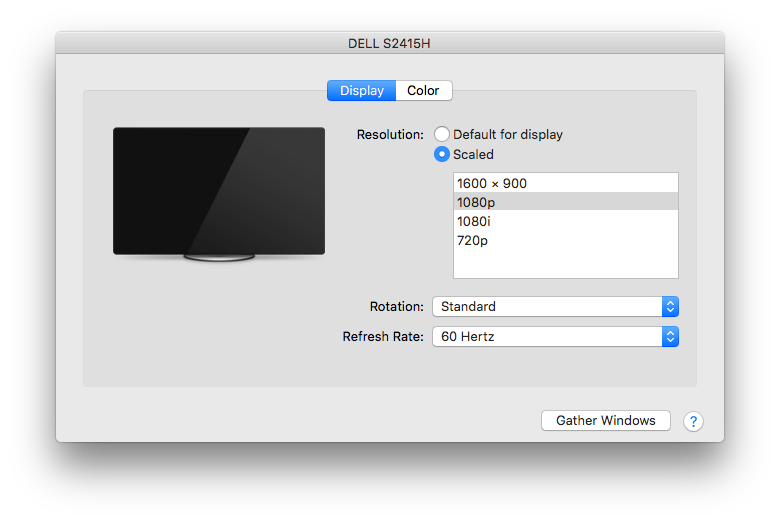
Changing the selection to the now-available "1080p" fixed the problem: All text and images on the monitor became nice and sharp again, and the overscan went away.
Symptoms When using a Pokken Tournament controller (which is a 16-bit-style controller with a D-pad only, no analog sticks) with the game Cosmic Star Heroine in Steam on PC, the game recognizes the up/down D-pad inputs as left/right. For example, pressing Up on the controller moves the character in the game to the left.) The game doesn’t recognize the left/right D-pad inputs at all. 
(From research I’ve done, I suspect that this issue may also affect other games built using the Unity engine, and/or the D-pad inputs on other controllers.) Workaround / Fix Part 1: Enable Generic Gamepad Configuration Support in Steam - Open Steam.
- In the Steam main window, in the View menu, select Settings.
- In the Settings window, select Controller (in the left pane), then click General Controller Settings.
- In the “Big Picture”-style Controller Settings window, check Generic Gamepad Configuration Support, then click Back. (You may need to maximize the Controller Settings window to see the Back button near the bottom of that page. Or, just close the window.)
Part 2: Set up controller configuration for Cosmic Star Heroine Part 2A: Open the Steam Controller Configuration window for Cosmic Star Heroine. - In Steam, select the Library pane.
- In your list of games, select Cosmic Star Heroine.
- Under “Links” on the right side of the window, click Controller Configuration.
Part 2B: Disable the Left Analog Stick input. 
- In the Steam Controller Configuration window, click the box in the lower-left that points to the left analog stick on the picture of the controller.
- In the Style of Input dropdown, select None.
- Click Back.
Part 2C: Configure D-pad input to be treated as Left Analog Stick input. - In the Steam Controller Configuration window, click the box in the lower-left-center that points to the D-pad on the picture of the controller.
- In the Style of Input dropdown, select “Joystick Move”.
- In the Output dropdown, select “Left Joystick”.
- Click Back.
Part 2D: Save and apply the changes. - Click the Export Config button.
- Click the “Save new personal binding” button.
- Give your configuration a name – I used “POKKEN” – and click Save.
- Close the Steam Controller Configuration window.
With this workaround, I’m finally able to play the 16-bit-era-like game Cosmic Star Heroine on my 16-bit-era-like, analog-stick-less Pokken Tournament gamepad controller! Other Things I Tried, Unsuccessfully I tried using the excellent JoyToKey to remap my controller’s D-pad presses to keyboard keys. Unfortunately, that didn’t work, as Cosmic Star Heroine then acted on both the remapped input and the original (and incorrect) D-pad input, such that pressing “Up” on the controller with my JoyToKey mappings active would result in my character moving diagonally up and left in the game. (And as of the time of this post, Cosmic Star Heroine doesn’t have any option to just disable or ignore controller input altogether, or to remap controllers from in the game itself.) I also couldn’t find any config files or registry keys to reconfigure or disable controller input. Finally, searching and posting on the Cosmic Star Heroine forum on Steam didn’t yield any solutions.
I recently did troubleshooting for, and managed to successfully fix, an issue where HTTPS connections to a specific remote server were failing to be made successfully. The client computers affected by the issue were a pair of servers, running Windows 2012 R2 and Windows 2008 R2, respectively. For the purposes of this post, I’ll use https://tls.example.com as the URL of the remote server. The Problem Symptom 1: In a C# program, an attempt to establish an HTTPS (SSL / TLS) connection to https://tls.example.com failed. Error message: “The request was aborted: Could not create SSL/TLS secure channel.” - The program did work fine to make connections to all other HTTPS URLs that we had tried.
- The exact same C# program worked fine when I ran it from my local workstation as the client PC (connecting to the same https://tls.example.com remote server).
Symptom 2: In Internet Explorer 11, attempting to connect to https://tls.example.com failed. Error message: “Turn on TLS 1.0, TLS 1.1, and TLS 1.2 in Advanced settings and try connecting to again. If this error persists, contact your site administrator.” 
- However, connecting to https://tls.example.com using the Chrome browser from that same client PC worked fine.
- Connecting to https://tls.example.com from my local workstation using Internet Explorer 11 also worked fine.
The Solution Note: This solution will only help if the remote server is configured with an SSL key that has an ECDSA (not RSA) signature, but all of the the cipher_suites that the client PC is configured to support are RSA (not ECDSA). Note 2: If you’re reading this post after August 2016, check and make sure the new cipher_suites value that you add is one that’s still cryptographically valid. These things tend to change over time! Note 3: Don’t use Registry Editor (as suggested here) unless you know what you’re doing. It can permanently damage your PC. In my case, the problem was caused by there being no match between the set of cipher_suites supported by the client, and the set of values that the server was able to accept. Specifically, in my case, the server had an SSL key signed with ECDSA (not RSA), and my problematic client PCs were configured to use only ECDSA (not RSA) cipher_suites. This caused SSL handshaking to fail after the initial “Client Hello” step. I was able to fix this by adding a ECDSA value to my client PC’s set of cipher_suites: On the client PC: - Open the Registry Editor.
- Navigate to HKLM/SOFTWARE/Policies/Microsoft/Cryptography/Configuration/SSL/0010002
- Edit the existing comma-separated value, and add a new value to the end that’s supported by the client OS, is cryptographically secure, and works with a key with an ECDSA signature. The value I used: TLS_ECDHE_ECDSA_WITH_AES_128_GCM_SHA256_P256
- Reboot.
Investigation Details The remainder of this post details the investigation that led me to the above solution. SSL / TLS protocol mismatch? I’ve run into SSL handshaking problems before caused by a protocol mismatch. For example, the client specified that it would only connect using SSL 3.0 or TLS 1.0, but the server would only accept TLS 1.2. However, that did not seem to be the cause of the issue here (despite the Internet Explorer error message): - In my C# program, I was specifying that the client accept any of TLS 1.2 | TLS 1.1 | TLS 1.0.
- In Internet Explorer’s Advanced Options dialog, I confirmed that the checkboxes for TLS 1.2, TLS 1.1, and TLS 1.0 were all already checked (again, despite the error message).
- In Firefox, by clicking on the green lock icon in the address bar after successfully connecting to the remote website, I confirmed that the connection was secured using TLS 1.2.

As far as I could tell, both the client and server should be agreeing on the use of TLS 1.2. Thus, probably not a protocol mismatch issue. SSL certificate trust chain issue? When I asked myself the question “So what’s different between my local PC (where things work fine) and my server PCs (not working)?”, the first answer I came up with was, maybe the installed trusted SSL root certificates? However, that theory turned out to be a dead end in this case. When I used the “Manage server certificates” / “certlm” tool to look at the installed certificates on my PCs at Certificates > Trusted Root Certification Authorities, although there were some differences between the root certs on my local Windows 10 PC versus the root certs installed on the Windows Server 2012 R2 PC, that didn’t turn out to be the cause of the problem. Additional symptom: System event log error My first clue to the actual problem was a Windows System event log error that I noticed would be logged whenever I reproduced the HTTPS connection failure in Internet Explorer or my custom C# program: “A fatal alert was received from the remote endpoint. The TLS protocol defined fatal alert code is 40.” A helpful MDSN blog post defined that error code of 40 as “handshake_failure”. Network traffic sniffing using Microsoft Message Analyzer As suggested by another very helpful Microsoft blog post, I installed Microsoft Message Analyzer. (It turns out that I needed to install the 64-bit version of Analyzer to match my OS, even though as far as I know, browsers typically run as 32-bit processes.) Using Message Analyzer turned out to be easy. I just did the following: - In Analyzer, hit the “New Session” button;
- Selected “Local Network Interfaces”;
- Hit Start;
- Switched windows to my C# program, and reproduced the issue;
- Switched back to Analyzer, and hit the Stop button.

I filtered out all irrelevant events captured while my session was running by applying this filter: (*Source == "www.example.com" or *Destination == "www.example.com") and *Summary contains "Handshake" (Where both instances of “www.example.com” were replaced with the actual host to which I was connecting.) On my local PC where the HTTPS connection was working, the Message Analyzer results included a “Handshake: [Client Hello]” message originating from my local PC, followed by a “Handshake: [Server Hello]” originating from the server. However, on the Windows Server 2012 R2 machine where the the connection was failing, I could see the “Handshake: [Client Hello]” from the local machine was followed by an “Alert” reply from the server! Doing a right-click | Show Details on the Alert reply, I could see that it contained a body message of “Level 2, Description 40”. This reply must have been what the System Event Log was picking up to generate that message that I’d noticed earlier. Comparing the successful and unsuccessful Client Hello messages At this point, I’d narrowed down the difference between the succeeding and failing environments to the differing server replies to the initial “Client Hello” step of SSL handshake. Still in Message Analyzer, I did another Show Details to compare the contents of the “Client Hello” on my Windows 10 PC (working) and my Windows Server 2012 R2 machine (not working). The significant difference turned out to be the cipher_suites parameter in the body of each PC’s “Client Hello” message. 
As I learned, the cipher_suites parameter contains the list of encryption settings which the PC sending the message is able to handle. The idea is that the server picks the one from that list that it prefers, sends a “Server Hello” reply that includes the selected cipher suite, and the two sides use that to securely communicate. It turns out that while my Windows 10 PC (working) was sending a selection of 33 cipher_suites values that it was able to support, the Server 2012 R2 PC (not working) was sending only 11 cipher_suites values! Each cipher_suites value, while it appears in the raw message body as an integer, “translates” to a descriptive string value like: TLS_ECDHE_ECDSA_WITH_AES_256_GCM_SHA256. (Message Analyzer helpfully performs this translation when displaying the values in the cipher_suites value under the “body” value, as is mostly visible in the screenshot above.) The Microsoft article Cipher Suites in TLS/SSL provides a very helpful picture of what the parts of those cipher_suites values mean, which I’ll borrow and display here: 
Taking a closer look, the 33 cipher_suites values from the Client Hello message Windows 10 PC (working) included a mix of cipher_suites values contained a mix of RSA, DHE, and ECDSA as the Signature value. The 11 values from the Server 2012 R2 PC (not working) all had RSA as the Signature value! A Certificate Signing Algorithm Mismatch? Discovering that the not-working Server 2012 R2 PC was effectively saying that it would only support RSA as the cert signing method immediately suggested a new likely theory: If the server cert was signed with something other than RSA, the SSL handshaking would fail. Sure enough, drilling further down into the cert details in Firefox showed that the cert was signed with not RSA, but ECDSA: 
In essence, the failing SSL handshaking conversation was going like this: - Client [Client Hello]: Hey, let’s talk securely, using any of these methods (…), as long as you’ve got an RSA-signed cert!
- Server [Alert]: Sorry, nope, I can’t do business along those parameters. Bye!
Getting the Server 2012 PC to accept an ECDSA certificate A great blog post by Nartac Software on how their IIS Crypto tool works pointed me to the solution. A Windows registry key mentioned in that article contained the same set of cipher_suites values that I was seeing in the problem PC’s Client Hello SSL handshake message: HKLM\SOFTWARE\Policies\Microsoft\Cryptography\Configuration\SSL\00010002
In the Server Hello SSL handshake message on my working Windows 10 PC, I could see that the cipher_suites value that the server had selected to successfully communicate with was:
TLS_ECDHE_ECDSA_WITH_AES_128_GCM_SHA256
From that same article, another registry location has the list of supported cipher suites on the server:
HKLM\SYSTEM\CurrentControlSet\Control\Cryptography\Configuration\Local\SSL\00010002
Looking in that registry location on the Server 2012 R2 PC, I saw that one of the supported values was
TLS_ECDHE_ECDSA_WITH_AES_128_GCM_SHA256_P256
With the cipher suite portion of that key being a match for the accepted value that had been accepted by the server in the SSL handshake from my Windows 10 PC, I edited the comma-separated list of cipher suite values from the first 00010002 registry key above to include this additional cipher key value. Finally, I rebooted the Server 2012 R2 PC (since a reboot is required to make the change take effect).
After the reboot, the problems were solved! Internet Explorer was successfully able to connect to the target website, and my C# app was also able to successfully establish an HTTPS connection.
So how had this happened?
I posed the question to the failing client PCs’ hosting provider: Are Windows Server 2008 R2 and Windows Server 2012 R2 machines configured by default to only accept RSA SSL certs, or is this something that the hosting provider configures in their “default” images?
The answer, it turned out, was neither of the above. Instead, the missing non-RSA cipher suite values had been intentionally removed in an “server hardening” task performed some time in the past. This probably made sense originally, under an assumption that these servers would never themselves be acting as the client side of an HTTPS connection, and therefore for the sake of reducing attack surface, could have cipher suites with signature types other than the servers’ own cert signatures disabled.
This post details a problem, and its corresponding solution, that my team encountered and recently resolved in the ATG 9.3 BCC application. Symptoms - In the BCC application, in the left nav menu, several of the menu items that should be present are missing, including:
- Content Administration | Automated Deploy
- Content Administration | Content Administration Project
- Merchandising | Manage Commerce Assets
- Personalization | Targeting and Segmentation
- When a user successfully logs into the BCC application, lots of errors like the following are logged in the CA application’s log file:
atg.process.ProcessException: Unknown segment "main" in process /Content Administration/CA.wdl at atg.process.ProcessManagerService.getSegmentInfo(ProcessManagerService.java:2122) at atg.process.ProcessManagerService.createProcessInstanceInfo(ProcessManagerService.java:11085) at atg.process.ProcessManagerService.getProcessInstanceInfos(ProcessManagerService.java:10928) ... - When the CA instance is initially started, some errors like the following that mention “atg.nucleus.ServiceException” and “dynamoMessagingSystem.xml” appear in the CA application’s log file:
atg.nucleus.ServiceException: Destination "sqldms:/Price/CacheInvalidation" is not found for output port "PriceCacheInvalidator" of "message-source" element with Nucleus name "/com/example/ecom/messaging/PriceCacheMessageSource" for patch bay definition file "/atg/dynamo/messaging/dynamoMessagingSystem.xml" at atg.dms.patchbay.PatchBayManager.createOutputDestination(PatchBayManager.java:1451) at atg.dms.patchbay.PatchBayManager.createOutputPorts(PatchBayManager.java:1249) ... Solution (This solution worked for my team’s application; YMMV.) In one of the dynamoMessagingSystem.xml files in our project’s source code, as child elements of the patchbay XML element, there were message-source and message-sink elements (and sub-elements) that were (apparently) incorrectly defined, and also were not actually being used by the application. Removing those bad elements from the dynamoMessagingSystem.xml file, and then rebuilding and redeploying the application, resolved the issue. Thanks to Miles from Oracle Support for his assistance in troubleshooting this issue!
Last September, my primary desktop PC at home (built 2008), running Windows 7 64-bit, started exhibiting a strange set of symptoms: The system would boot up normally, but after that, certain operations, particularly operations needing to read from the hard drive, would take far longer than normal. For example: - Pressing Ctrl+S (Save) from Notepad would take a full minute to display the Save dialog, but the file would save normally after that;
- Copying files between the two internal hard drives (C: and D:) worked, but took about 20x as long as normal;
- Applications would sometimes take a very long time (1-2 minutes) to initially start;
- The game “Torchlight 2” would start, but the “loading” screen would never go away, and the background music looped abnormally, playing the same segment of music over and over again every 5-6 seconds.
- These problems would all seemingly get worse over time, until I rebooted the PC.
Not having run across an issue like this before, I tried quite a few different troubleshooting steps: | Troubleshooting Step Tried | Outcome | | Warm boot (restart the PC) | No effect | | Cold boot (power off and then power on the PC) | No effect | | Windows System Restore | Failed, with a “Failure restoring registry” error | | chkdsk /f (“Check disk” utility from the command prompt, with the “fix” parameter) | Ran ok and reported no errors for either C: or D: | | Ran the Windows built-in RAM diagnostic | Ran ok and reported no issues | | Virus scan with Microsoft Security Essentials | Ran ok and reported no issues | | Reseated hard drive SATA cables for both drives | No effect | | Killed various processes via Task Manager (suspecting a virus?) | No effect | | Disconnected the D: drive (the non-boot data drive) | No effect | | Booted into Safe Mode | No effect – Slowness issue occurred even in Safe Mode | | Ran System Restore from Windows bootable CD | Failed, same as when running System Restore from Windows itself | Finally, with other options exhausted, and uncertain whether the root cause might be a software issue with Windows itself, I took the extreme step of “repaving” the PC: Formatting the C: (boot drive) and reinstalling Windows 7. Doing that actually did initially seem to solve the problem; Windows installed with no issues on the reformatted C: drive, and I was able to reinstall and use all of my applications – for a time. Unfortunately, in January, the exact same issue suddenly started manifesting again. The PC would boot ok, and run okay for a few minutes, but then suddenly certain operations like opening new applications or saving files would suddenly start taking far longer than normal. Further, the problem started getting worse across reboots (as I ran through various troubleshooting steps), eventually to the point where Windows would hang while starting up. This time, suspecting a hardware problem with the C: drive, I took a troubleshooting step that I hadn’t tried previously: I powered off the PC, disconnected the C: drive, and powered the PC back on. Although I wouldn’t normally recommend running a PC this way, I actually had an old bootable install of Windows Vista sitting on the D: drive. With the normal boot disk (C:) disconnected, D: became the boot disk, and the old Vista install booted right up. (I also physically disconnected the PC’s network card before doing this, not wanting to run afoul of any potential 2013 security issues that a circa-2009 instance of Vista might not be equipped to handle.) Playing with the Vista install running off the D: drive, I obviously couldn’t really test any non-trivial applications, but the Windows desktop itself was actually usable enough, and exhibited no signs of the slowness issue that the exact same PC configuration, except with the C: drive connected, had been showing. From this, I tentatively concluded that the issue was a physical problem with the C: hard drive – one that my earlier chkdsk and other diagnostic measures targeted at the hard drive hadn’t picked up for whatever reason. So I set aside the old, presumably bad, C: drive. Then – figuring I might as well get a system upgrade out of this whole ordeal! – I ordered a speedy new hard drive, a Crucial m4 128GB 2.5-Inch SATA 6Gb/s Solid State Drive (SSD) (model CT128M4SSD2 - $116 on Amazon.com as of 3/2013), to serve as the new C: boot disk. Once the drive arrived, I connected it, once again installed Windows 7, re-installed my applications, and the system is once again running great! It’s been about 2 months now since the second instance of the “slowness” issues happened, and not only have there been no signs of it returning, but the system now boots faster than ever with the new SSD serving as the boot disk. I’ll update this post should the slowness issue ever return – but if you don’t see any updates to this post, you can assume that things are still running smoothly -- or that this PC was retired without this issue ever re-occurring!
This past week, my HTPC spontaneously started having a problem where, when booting, after the Windows logo was displayed, I would just get a blank (black) screen. Windows apparently loaded ok – I just couldn’t see anything the screen. One afternoon, things were working fine, but later that evening (not having manually made any changes to the PC), the problem started occurring. In an attempt to keep this post brief, I’m going to omit the myriad of troubleshooting steps that I went through to try to correct this, and just provide the one that worked for me. If you’re having a similar issue, you can skip to the end of this post for my solution, although I’d suggest at least skimming the System Configuration and Symptoms to get a better idea of whether or not this solution might be applicable for your situation as well. System Configuration This problem occurred on a PC running Windows 7 Home Premium 64-bit, with an nVidia GeForce GT 430 video card, connected via HDMI cable to a TCL L40FHDF12TA LCD HDTV. Prior to the problem occurring, the PC was successfully sending both video and sound to the HDTV via an HMDI cable, connected to the HDMI-out on the video card, and one of the HDMI-in ports on the TV, at the TV’s native resolution of 1920x1080 (1080p). Symptoms - Upon a reboot, the PC would correctly display the text-mode POST information, followed by the graphical Windows 7 logo; but after that, the TV would just display a blank (black) screen. The TV would report it was getting a 1280x720 signal from the PC. Also, the normal Windows boot sound did not play (even though I did have the volume up on the TV).
- The problem would persist even after turning the TV off and back on, or changing channels on the PC and then changing back to the “HDMI 1” input, or when disconnecting and reconnecting the HDMI cable (without rebooting).
- When booting into Safe Mode, the Windows desktop would display properly, and the system would be usable (albeit without sound, and at a reduced screen resolution).
- At one point midway though the troubleshooting process, I got things “partially fixed” such that the Windows desktop would come up when booting normally (not into Safe Mode). (Unfortunately, I don’t recall exactly which specific troubleshooting step I took over the course of the multi-hour troubleshooting process to make this happen.) When in the system was in this state, I observed multiple problems:
- In the Screen Resolution dialog, Windows would only let me let me set the monitor to a maximum resolution of 1280x720 – not the full resolution of 1920x1080 supported by the TV.
- Windows recognized the monitor as a “Generic non-PNP monitor”, not as the actual TCL TV model.
- No sounds would play. In the Sound dialog (accessed from the Control Panel), there was an nVidia HDMI sound output listed, but it had a listed status of “Not plugged in” (even though the HDMI cable actually was plugged in).
- The nVidia Control Panel software showed that the monitor was connected via DVI – not via HDMI as it actually was connected. The software didn’t display a dropdown that would allow the connection type to be changed.
- The same symptoms persisted when connecting the PC to the TV via the video card’s DVI-out port, the TV’s HDMI-in, and a DVI-HDMI adapter (and rebooting).
Solution After trying many things to fix this, what eventually ended up working for me to fix the problem was to use Windows 7 System Restore to restore the system to a restore point a couple of weeks before the problem started happening. Once this was done, all symptoms immediately went away; the TV once again successfully sent video and sound to the TV, Windows recognized the monitor as a TCL TV (not as a “generic non-PNP monitor”), and Windows allowed me to change the screen resolution to the TV’s native resolution of 1920x1080. I’m still somewhat mystified as to the initial root cause of the problem; my best guess is that some Windows system file related to display output was (somehow) damaged, and that this was corrected by the System Restore. The only thing listed on the System Restore dialog between the present time and the restore point that I selected (other than several manual video driver updates that I had applied during the troubleshooting process) was a series of automatically installed Windows Critical Updates. (The problem apparently wasn’t with one of the nVidia video driver files, as I tried installing multiple different versions of the display driver software to correct the problem, without success. I even went so far as to use a “driver cleaner” utility to clean out all of the old nVidia files and registry entries before re-installing a new driver.) If you’re having the same problem that I was, this solution may or may not work for you. Still, it may be worth trying a System Restore as part of your troubleshooting process if other more obvious solutions (checking cables, reinstalling the video driver, etc.) aren’t working for you. I hope this helps!
I got a call from my wife while I was at work yesterday: There was a problem with our primary home PC, which runs Windows 7. As the machine was booting, after the BIOS data appeared followed by the graphical Windows 7 “loading” logo on the primary monitor, the primary monitor went into sleep mode (as though it had been unplugged from the PC). By moving the mouse around, the mouse cursor was visible on the secondary monitor, but clicking it (including right-click) didn't do anything. Getting home, I saw the problem for myself. I concluded that the Windows logon screen was being displayed on the primary monitor -- I just couldn't see it because the primary monitor was off. I was able to log onto the machine blind (by arrowing over to my user profile, hitting Enter to activate it, keying in my password, and hitting enter again to log in). Once in to Windows, I was able to make my secondary monitor become the primary monitor, via right-click on the desktop, selecting Screen Resolution from the Right-click menu, “rescuing” the Screen Resolution window from the sleeping primary monitor onto the secondary monitor to make it visible, then checking the “Make this my main display” checkbox on the secondary monitor. I spent pretty much the entire evening troubleshooting the problem. Here the long list of troubleshooting steps I tried: Verify both ends of the monitor cable were firmly seated: It was seated properly. Cold reboot: No change in behavior. Install the latest video driver (for the video card, an NVidia Geforce 6800 GT): No change in behavior. Install the latest monitor driver (for the primary monitor, a ViewSonic VX2035wm connected via DVI): No change in behavior. Uninstall the monitor drivers (and let Windows reinstall them after rebooting): No change in behavior. Uninstall Microsoft Security Essentials (which I had just recently installed) (on the theory that MSE could somehow be seeing the ViewSonic monitor driver as malware): No change in behavior. (I reinstalled MSE again afterwards.) Restore the system to a restore point from a few days prior (when I know the monitor had been working fine): No change in behavior. Reboot into Windows Safe Mode: This actually did get the logon screen, and then the Windows desktop, to display properly on the primary monitor. I was even able to increase the screen resolution from the safe mode default (1024x768, I think) back to the native resolution of 1680x1050. I was not able to use dual-monitor display, though; the Screen Resolution dialog only detected the primary monitor while in Safe Mode. Rebooting again (back into normal mode) brought me back to square one. Uninstall the video driver (then reboot): After rebooting, the behavior was similar to safe mode; the primary monitor worked, but not the secondary. Upon reinstalling the NVidia video driver and rebooting once more, it was again back to square one. Reseat the video card (with the PC powered off, then boot back up): No change in behavior. Unplug the secondary monitor (leaving only the primary monitor plugged in) (then reboot): This didn’t help. I still got, after rebooting, the BIOS information visible, the graphical Windows 7 logo visible, then blank screen / sleeping monitor. Swap the ports that the two monitors’ DVI cables were plugged into, then reboot: This actually caused me not to get anything display on either monitor. I changed it back afterward. Check BIOS settings: I didn’t notice anything unusual, or any settings that I could change that might be likely to fix the problem. I ended up leaving everything alone. Finally, after all that, I hit upon a good solution: I replaced the video card. Specifically, (after powering both machines down and unplugging them, of course), I pulled the GeForce 6800 GT from my primary machine and set it aside; then, I pulled the GeForce GT 430 from my HTPC (leaving that PC with just the motherboard’s onboard audio/video), and installed that card in my primary PC; then I booted the primary PC back up. After doing that, and letting Windows install the NVidia display driver, both monitors came up with no problem. So even though I had been pretty convinced initially that I was looking at a software problem, probably a driver problem of some kind (given that the primary monitor worked fine at boot time, and even displayed the graphical windows logo, and also worked fine in Safe Mode), the problem apparently was that my GeForce 6800 GT decided to (partially) fail on me. It was actually my lovely wife that made the astute observation that the fact that I had been fairly recently running that card at a scorching hot 100+ degrees C probably hadn’t helped matters! Note that I don’t recommend that anyone else who encounters this issue (and comes across this blog post via a search) run out and spend $$$ to replace your video card as your first option. In researching this issue online during the course of the troubleshooting, I did run across some reports from others of this same problem (screen goes blank after displaying the Windows logo during boot) who were able to solve their issue by doing one of the other steps that I tried, such as uninstalling and reinstalling video drivers. For the time being, I’m in good shape with my workaround. The lower-end but newer GeForce GT 430 is actually almost as good a video card as the original 6800 GT; and the HTPC can play TV and movies fine with the onboard video. I guess this gives me something to put on my birthday list for my birthday coming up later this year!
At work, I recently had the chance to upgrade to a new development laptop PC, a Thinkpad T520 running Windows 7. The machine is excellent, with one weird exception: In Firefox (and only in Firefox), when keying in text into a text entry field in a web page or into the browser address bar, the caret (i.e. the text entry cursor) would sometimes appear to be “distorted” or “corrupted” – that is, some “garbage” pixels would appear around the caret whenever I moved it (either by typing in a character, or by using the arrow keys). Problem Details The problem is hard to explain, so here’s a screen capture of a particularly severe example that occurred when I was entering text into a textarea. The caret in this cropped screen shot is between the “2” and “5” in “8/25/2011”; note all the other weird stray black and white marks in the text. (I added the red oval to the screen capture to show the area in which the “corruption” was appearing. 
After waiting a little less than a second without moving the caret, the problem would go away – the “corruption” would disappear from the display. However, the problem would come right back upon moving the caret again. The caret itself would also sometimes not appear until the “corruption” went away, which made text editing surprisingly difficult – a frustrating problem. Investigation The problem would only occur in Firefox, not in other browsers such as Internet Explorer 9, or in any other applications I tried (such as Eclipse, Word, and Notepad). Experimenting, I found that the problem would not occur when Firefox was started in Safe Mode (via Firefox menu | Help menu | Restart with Add-ons Disabled). However, I tried running Firefox in normal mode with all extensions and add-ons manually disabled, and that didn’t help. I tried setting up a new Firefox user profile, and that didn’t help either. I also noticed that beyond the issues with the caret, the actual rendering/shape of letter character glyphs being typed into Firefox was affected. The characters themselves appeared “wrong” when Firefox was running in normal mode, but they appeared normally with Firefox in safe mode. Here are two cropped screen shots I took of a bunch of “f” characters being entered in to the address bar, the first in normal mode, the latter in safe mode: 

Here’s a zoomed-in view (again, normal mode first, then safe mode): 

Note that in the former image (Firefox normal mode), the “f” glyphs do not appear the same as one another and have some faint red/yellow/blue/green aliasing (blurring), whereas in the latter screen capture (Firefox safe mode) each “f” glyph is identical and has no aliasing (look at the unzoomed image). At this point I was suspicious of some kind of issue with my video card. The normal first course of action with a suspected video card behavior issue would be to update video card drivers. When I checked, though, I found that I was already running the latest drivers for my video card (an NVidia NVS 4200M). Google was initially no help; all the searches that I tried for terms like “firefox cursor corruption” or “firefox caret appearance” resulted in pages talking about the Firefox caret navigation feature (F7 key), which was not the issue here. Solution I hit upon the solution when I changed angles of attack and Googled for “firefox safe mode”. The first result was a Firefox help article describing safe mode, which linked to a Mozillazine knowledge base article with more details on Firefox safe mode. That article in turn had a list of about a dozen bug repots related to safe mode, one of which was Bug 591139 - Disable hardware acceleration in safe mode. Aha – that sounded like a video-related issue! Reading through that ticket, I learned that starting in Firefox 4, a feature called “hardware acceleration” (with which I was previously unfamiliar) is disabled when Firefox is in safe mode. Hitting up Google once more, this time for “firefox disable hardware acceleration,” I was led to a setting in the Firefox options menu: Firefox menu | Options | Advanced | General tab | Use hardware acceleration when available. I unchecked that setting, restarted Firefox, and that did it – the problems with the caret corruption/garbage and the malformed character glyphs no longer occurred! So apparently Firefox has an on-by-default feature where it uses hardware acceleration, presumably from the local PC’s video card, further presumably to improve its performance and/or ease load on the primary CPU. However, having disabled this setting, I haven’t noticed any appreciable difference in performance. I don’t know who is to blame for this issue – bad video driver, bad video hardware, Firefox itself, some combination of those, or something else entirely – but for the time being, I’m just satisfied that the issue is resolved for me! I hope this saves some frustration and/or troubleshooting time for anyone else experiencing this odd issue!
Earlier this week, I started having an unpleasant problem with my PC: While playing a game, both monitors connected to my PC would go black (as though the PC had powered off), and the system became unresponsive (the Num Lock light would no longer turn on and off when hitting the Num Lock key). However, the music the game was playing would keep playing -- indicating that the PC hadn’t totally hung or shut down. Opening the PC case, I noticed that my video card was very hot to the touch. I had this happen three times in one night, in all cases happening while I was playing a game. (It happened originally while playing Torchlight, and then again later while playing Magic: The Gathering 2012, and once again while playing the Avadon: Black Fortress demo.) Given these symptoms, my original suspicion was an overheating-related issue with my video card (GPU), a XFX NVIDIA GeForce 9800 GT. (The problem seemed to happen while the video card was under load; the system caused the monitors to go black but sounds kept playing; the video card was hot to the touch; the problem happened intermittently, across multiple applications.) I posted the problem to SuperUser.com and got a helpful reply from user “Mokubai” confirming that the problem was indeed likely due to a GPU overheat, as well as a link to a very helpful free utility, GPU-Z, which (among other features) provides real-time reporting of the current GPU temperature. I downloaded and ran GPU-Z. It reported that the video card temperature with my PC just sitting idle at the Windows desktop was 83 degrees C (hot!). I put GPU-Z on my secondary monitor and fired up Torchlight (a 3D game) in the primary window; after playing for just a few minutes, GPU-Z reported that my video card was up to a maximum temperature of 101 degrees C (extremely hot!), with the card’s fan running at 100% speed. Clearly the GPU temperature was almost certainly to blame for the problem of my monitors losing signal and the PC hanging. Tonight, I had some time to work on the problem, so I shut down and unplugged the PC and then removed the video card. The card was pretty grimy with dust. I used a small Phillips screwdriver to remove the six screws holding the “cover” onto the card, and then removed the cover itself. Having done that, I could see that there was a lot of dirty material stuck in the narrow grooves of the heatsink, which was likely obstructing the air flow through the heatsink and preventing the card’s fan from cooling off the heatsink, causing the high temperatures. I took a pipe cleaner and cleaned all of the gunk out of the heatsink, the fan blades, and the other parts of the card. Much better!  
(Images above: Left, XFX GeForce 9800 GT with cover removed, before cleaning; Right, after cleaning.) Having thoroughly cleaned the video card, I replaced the cover and the screws, reinstalled the card in my PC, and then powered the PC back on. The result: Much improved temperature readings from GPU-Z! The GPU now idles at the Windows desktop at 61 degrees C, and hit a maximum temperature of 79 degrees C with an average temperature of around 75 degrees C while playing a session of Torchlight. The video card’s fan speed never went above 43% while playing the game, indicating that the card itself didn’t think that it was running too hot. Given that I was originally considering buying a new video card to deal with this problem – a solution that would have run me in the neighborhood of $100 – I’m pretty happy that I was able to fix this issue of the monitors going black while gaming “for free” just by taking a few minutes to give the video card a good cleaning.
I was recently having an issue on both my home and work machines where I couldn’t log in to my delicious.com (formerly del.icio.us) account via Firefox. After entering my login credentials, I would be redirected back to the page where I was before, but the site would still show me as being an anonymous user, rather than showing me as logged in as expected. If I entered invalid credentials, the login page would give me an “invalid credentials”-type error as normal. I could log into delicious.com ok using other browsers (I tried it in Internet Explorer 9). The fix was to clear all of my delicious.com cookies from Firefox. In Firefox 5, I did this as follows: Tools menu | Options | Privacy | remove individual cookies, selecting all of the delicious.com cookies (I had about 8), and clicking Remove Cookies. After doing this, I could log into delicious.com normally.
A couple of weeks ago, I had a hankering to play a classic RPG game. After looking around at the available options for systems that I own, I decided to pick up a copy of Dragon Quest V for the Nintendo DS. Unfortunately, even though the game was released in the U.S. just last year (2009), it’s already out of print, so I went to eBay. There were just a few copies of the game for sale; most were going for around $30, but one “cartridge only” auction was going for a “buy it now” price of $17. The auction was from a seller in New York and nothing about the auction at the time made me suspicious (though perhaps it should have – keep reading), so I went ahead and bought the auction. I got the game in the mail a few days later, and played it. The game didn’t slide particularly smoothly into my DS Lite – it was a slight “pressure fit” – but I didn’t really think anything of it at the time. The game started up with no problems. After viewing the introductory sequence (showing the main character’s birth) and proceeding to the first playable portion of the game (where the main character, now a child, is travelling on a small ship), I ran into a problem: I couldn’t figure out how to get off the boat or otherwise advance the plot. I’d talked to all of the NPCs on the ship several times each, and explored everywhere that I could; after doing that, there just seemed to be nothing else to do, and no enemies at all to fight. Eventually I consulted gamefaqs, but none of the FAQs gave any special attention to the boat scene – they all just seemed to assume that advancing past the scene would present no problem at all. I searched Google for terms like “dragon quest v boat stuck,” and got my first obvious clue that something was not right. Apparently the programmers at Square Enix, the game’s developer/publisher, included code in the game that when playing a counterfeit copy of the game, the player would experience game behavior exactly matching the problem I was having – the game would just never advance past the boat scene, and the player would basically be stuck. However, all of the references to this behavior that I found were in reference to players playing an unauthorized copy of the game via an emulator. I, on the other hand, was playing what I had thought to be a legitimately-purchased copy of the game, on actual physical Nintendo DS Lite hardware. Still, the behavior I was seeing made me strongly suspect that I’d been sold an unauthorized, or “bootleg,” copy of the game.  Researching further, the copy of the game that I’d been sent had a serial number on the front of the cartridge of “NTR-CDXP-EUR.” Googling on that, I found two things: Researching further, the copy of the game that I’d been sent had a serial number on the front of the cartridge of “NTR-CDXP-EUR.” Googling on that, I found two things:
- That serial number actually apparently was assigned to some game called “Driving Theory Training” (and not to Dragon Quest V);
- A few forum posts from other people saying that they had a DS cartridge with that serial number (of various other games, neither Dragon Quest V nor “Driving Theory Training”) and they were suspicious that the cartridge was a bootleg.
This convinced me that I did have a bootleg cartridge on my hands. This made me pretty unhappy – I purchase all of my games legitimately, and don’t “pirate” games. If a particular game costs more than I’m willing to pay to play it, then I simply don’t play it. I contacted the seller, and he agreed to refund my money upon my shipping the cartridge back to him. He claimed to be unaware that he was selling bootleg copies of games, and said that he would take the issue up with his supplier. Ultimately I’m not sure exactly how honest he was being, but he did end up refunding my money (less the the $3 and change that I paid to ship the game back to him). So: What should I have done to avoid buying this game to begin with, and what should I do to avoid buying counterfeit game cartridges in the future? None of the following points taken on its own is a certain indication of a bootleg game; however, all together, they may be adequate cause for being suspicious of a particular auction: - Price: The low sell price of this game relative to other auctions for the same (somewhat rare) game should perhaps have been cause for suspicion.
- Contents: The fact that the game was “cartridge only,” rather than including case and manual, should perhaps have been cause for concern. (Again, certainly there are many legitimate “cartridge only” auctions, but this taken in combination with other factors should have raised a red flag.)
- Origin: This particular auction was shipping from New York rather than from China; I have seen, though, some other sales of unusually low-priced games originating in China that are pretty obviously for counterfeit copies.
- Image: The auction listing included an image of the cartridge, but it was blurry, and the serial number on the front of the cartridge was unreadable.
I couldn’t have determined this from looking at the auction online, but when I tried physically lining up the counterfeit game next to a few of my legitimate DS games, the difference was fairly obvious. Although the counterfeit cartridge on its own was pretty legitimate-looking upon a casual inspection, the size and shape of the cartridge were just barely “off” compared to the other legitimate cartridges, which were all identical to one another. (This was the cause of the issue I mentioned of the bootleg cartridge not quite being an easy fit into my DS Lite, like legitimate games all are.) At least this incident was a learning experience -- that bootleg console game software is out there and is being sold. In the future I will likely take one or both of the following steps before bidding on an auction that seems like it might be suspect: - Just ask the seller if the game is a genuine copy. If the answer is anything other than an honest-seeming answer along the lines of “yes, absolutely,” then don’t bid.
- Ask the seller what the serial number on the front of the cartridge is (if it isn’t visible in a photo on the auction). If it isn’t what it should be, then certainly do not bid.
I might never have realized that I was playing a counterfeit copy if there hadn’t been this particular variety of DRM built into the game. I’m not normally a big fan of DRM (who is?), but I understand the necessity of it; still, I wish this DRM had been of a “fail fast” nature (i.e. have the game refuse to run at all if it identified itself as being counterfeit) – then I wouldn’t have lost a couple of hours of my evening to playing a broken game and researching the problem. I’d much rather have just had the opportunity to honestly purchase a legitimate copy of the game (and avoid supporting whatever pirate created this unauthorized copy) the first time.
|
|


